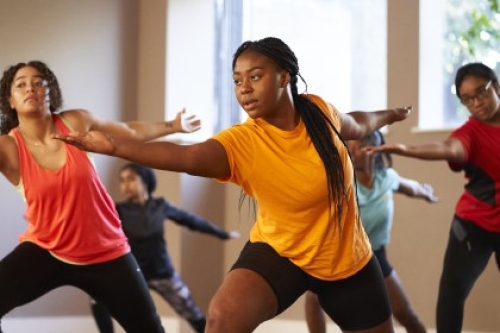

Our Movement Hub pilot showcases the best of our tools and resources to help everyone in the sport and physical activity unite the movement.
Chair welcomes National Lottery Good Causes Call for Evidence
1 July 2026
The Government is seeking views on how National Lottery funding can continue to deliver the greatest possible benefit for communities across the UK.
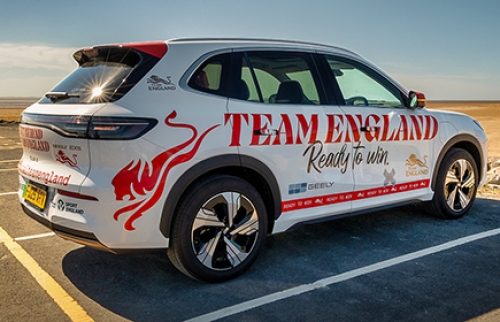
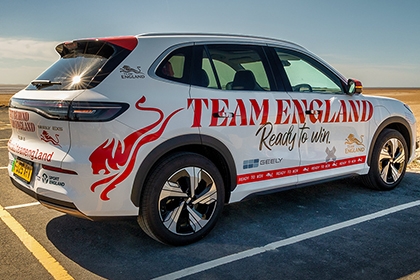
Glasgow 2026

Our summer of sport continues in Glasgow
As the Commonwealth Games take place in Glasgow, our strategic lead for talent and performance previews what makes the event special for everyone involved, and like no other when it comes to accessibility, inclusivity and representation.
What Birmingham 2022 meant for the Commonwealth Games
With the Glasgow 2026 Commonwealth Games in full swing, we look back to the positive legacy of the last Games and how we’re backing this year’s event.

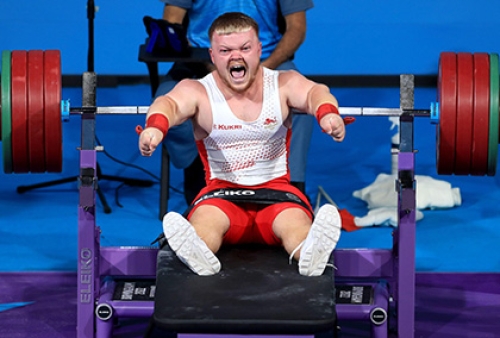
Backing the Best: six to watch at Glasgow 2026
We profile some of the Team England athletes and teams competing at the Commonwealth Games whose development has been supported by our Backing the Best funding.
What we do
We award funding
We fund projects and organisations small and large that help people to get active.
We provide insight
Our insight will help you understand how different people can be supported to be active.
We gather data
We have a number of different tools you can use to explore activity levels across England.
We have expertise
Our expertise is not just for us, we share that knowledge to help you and people across the sector.
Environmental sustainability
Using the Every Move strategy and action plan, we want to lead, inspire and support the sector to become environmentally sustainable, enabling greater opportunity for all people to participate in sport and physical activity, now and in the future.

Sport England and the National Lottery
By playing the National Lottery, you're helping people across England play sport and get physically active. That's because two-thirds of our funding comes from the lottery. Thank you to everyone who has ever bought a ticket for supporting us in building a healthier, happier nation.
Engage your audience
Browse more topics

Image library
We have a wide selection of sport and physical activity images that are free for you to use, whether it’s for a brochure, banner, leaflet or report.

Facilities and planning
See our advice on designing high-quality facilities, as well as guidance on planning applications that impact sporting provision, and our playing fields policy.

Active Lives
Our Active Lives surveys measure the physical activity levels of adults and children and young people across England, providing a wealth of data.